Investing in the stock market isn’t just about following trends or reacting to news headlines. If you want to make informed, long-term investment decisions, fundamental analysis (FA) is an essential skill to master. It helps you determine the true value of a company by looking at its financial statements, industry position, and economic factors.
In this guide, we’ll break down the basics of fundamental analysis, how it works, and how you can use it to build a strong investment portfolio.
What Is Fundamental Analysis?
Fundamental analysis is a method of evaluating a stock by analyzing the company’s financial health, business model, and external economic factors. The goal is to determine whether a stock is undervalued, overvalued, or fairly priced.

Investors who use fundamental analysis believe that the market doesn’t always price stocks correctly in the short term, but over time, the true value will be reflected.
Key Components of Fundamental Analysis
To conduct fundamental analysis, investors look at two main categories:
1.Quantitative Analysis – Examining financial numbers and ratios from company reports.
2.Qualitative Analysis – Evaluating the business model, industry position, and management.
Let’s dive deeper into both.
1. Quantitative Analysis: Financial Statements & Key Metrics
The foundation of fundamental analysis lies in a company’s financial statements. There are three key reports to analyze:
- a) Income Statement (Profit & Loss Statement)
- Shows revenue, expenses, and profit over a specific period.
- Important metrics:
- Revenue (Sales): How much the company earns.
- Net Income (Profit): Revenue minus expenses.
- Earnings Per Share (EPS): Profit per share of stock
- b) Balance Sheet
- Snapshot of a company’s assets, liabilities, and equity at a given time.
- Important metrics:
- Assets: What the company owns (cash, inventory, buildings, etc.).
- Liabilities: What the company owes (loans, debts, obligations).
- Shareholder Equity: Assets minus liabilities (net worth of the company).
- c) Cash Flow Statement
- Tracks the flow of cash in and out of the business.
- Important metrics:
- Operating Cash Flow: Cash generated from business operations.
- Free Cash Flow (FCF): Cash left after paying expenses, crucial for growth.
Key Financial Ratios to Know

Price-to-Earnings (P/E) Ratio: Stock price divided by earnings per share. A lower P/E might indicate an undervalued stock.
•Price-to-Book (P/B) Ratio: Stock price compared to its book value (net assets).
•Debt-to-Equity (D/E) Ratio: Measures a company’s financial leverage. A high D/E means more debt.
•Return on Equity (ROE): Profitability measure showing how efficiently a company uses shareholders’ funds.
2. Qualitative Analysis: The Story Behind the Numbers
Beyond the numbers, understanding what makes a company successful is crucial.
a) Business Model & Competitive Advantage
- How does the company make money?
- Does it have a unique product, brand strength, or competitive edge.
- Example: Apple’s ecosystem of devices and brand loyalty give it a strong advantage.
b) Management & Leadership
- A company’s success depends on its leadership.
- Look at the CEO’s track record, company culture, and strategic decisions.
- Example: Tesla’s innovation is closely tied to Elon Musk’s leadership.
c) Industry & Market Conditions
- Is the company in a growing industry or a declining one?
- Are there economic factors (inflation, interest rates, etc.) affecting growth?
d) Economic & Political Factors
- Government policies, trade regulations, and macroeconomic trends impact business performance.
- Example: Rising interest rates can slow down borrowing and affect business expansion.
How to Use Fundamental Analysis for Investing
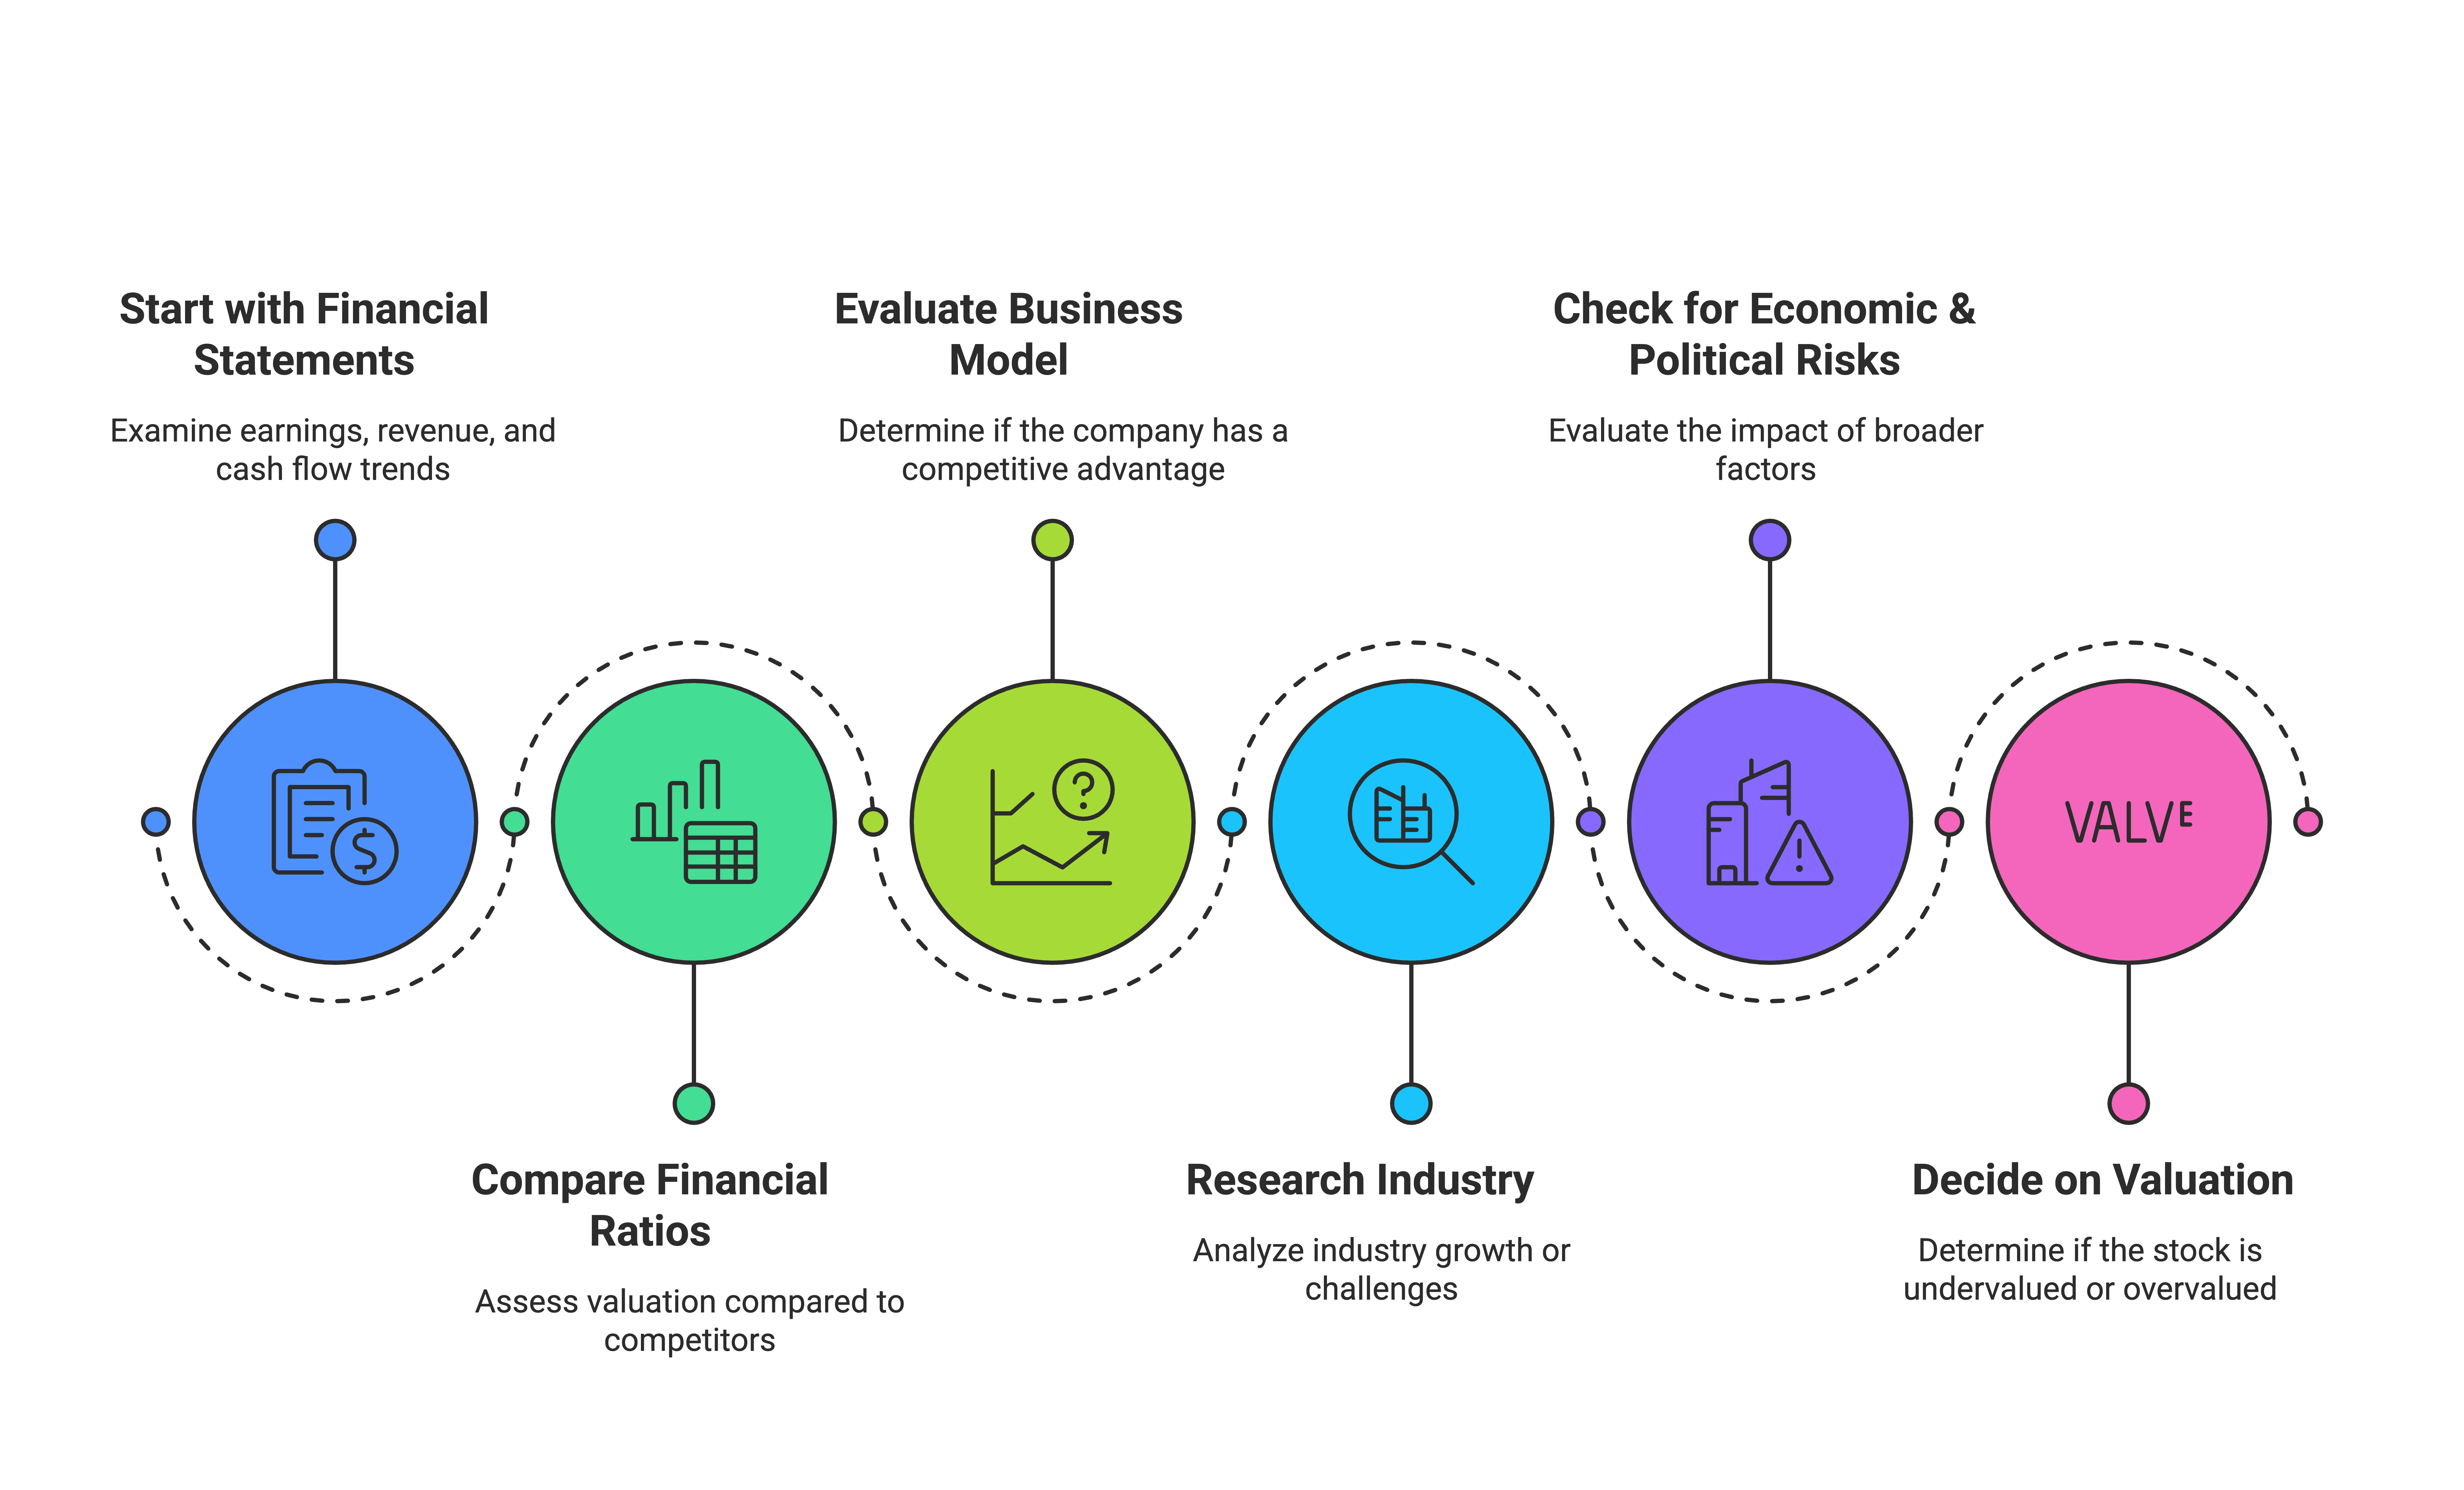
Here’s a step-by-step process to analyze a stock using FA:

- Start with the financial statements – Look at earnings, revenue, and cash flow trends.
- Compare financial ratios – Assess valuation compared to competitors.
- Evaluate the company’s business model – Does it have a competitive advantage?
- Research the industry – Is the sector growing or facing challenges?
- Check for economic & political risks – How do broader factors affect the company?
- Decide on valuation – Is the stock undervalued or overvalued?
Fundamental vs. Technical Analysis: What’s the Difference?
Feature | Fundamental Analysis | Technical Analysis |
|---|---|---|
Focus | Company’s financials & business model | Stock price trends & charts |
Time Frame | Long-term investing | Short-term trading |
Main Tools | Financial statements, ratios, industry trends | Price charts, indicators (RSI, MACD) |
Goal | Find undervalued stocks | Identify short-term price movements |
Many investors use both methods. Fundamental analysis helps identify good companies, while technical analysis helps time the purchase or sale.
Final Thoughts: Why Fundamental Analysis Matters
Fundamental analysis is one of the best ways to invest with confidence. Instead of blindly following stock tips or market hype, you’ll make data-driven decisions based on real financials and business fundamentals.
It takes time to master, but once you understand how to analyze a company, you’ll be able to:
✅ Spot undervalued stocks before they rise.
✅ Avoid overhyped companies that lack strong fundamentals.
✅ Build a long-term investment portfolio based on solid research.
Are you ready to start analyzing stocks like a pro? Pick a company, dive into its financials, and see what story the numbers tell!
What’s your favorite stock-picking strategy? Let me know in the comments! 🚀
